


Illumina Protein Prep
This automated NGS-based proteomics solution with SOMAmer technology and Illumina sequencing and analysis detects and quantifies 9.5K human proteins in 2.5 days.
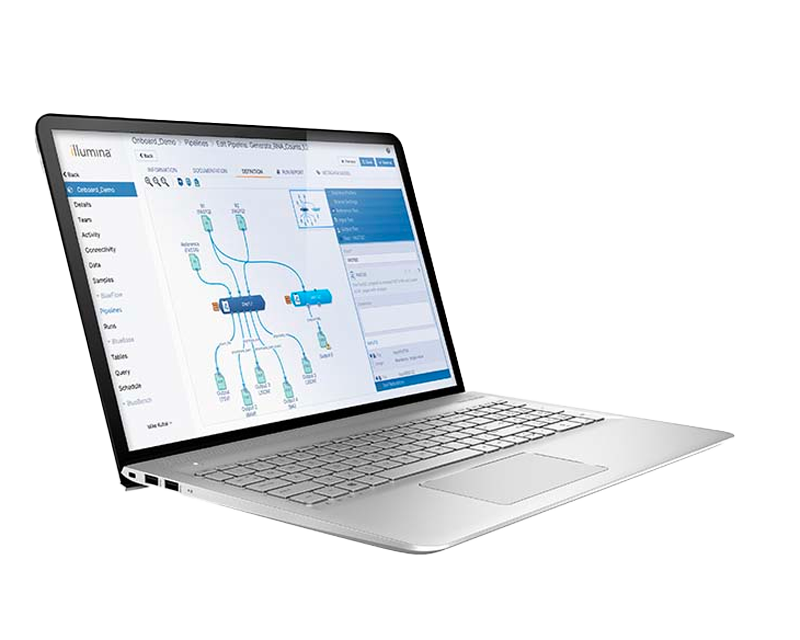
Illumina Connected Multiomics is a powerful and intuitive cloud-based solution that enables multiomic data analysis and visualization at scale.
Illumina Connected Multiomics is an easy-to-use bioinformatics platform that streamlines the analysis of NGS, arrays, and large-scale multiomic data in an intuitive visual user interface. Powerful statistical algorithms, information-rich visualizations, an interactive interface, and cutting-edge genomic tools empower researchers to analyze their data confidently, without the need for advanced informatics expertise.
Illumina Connected Multiomics leverages analysis tools built using publicly available, industry-standard statistical algorithms, including models for normalization and noise reduction, to uncover patterns across omics layers
Preconfigured and customizable analysis options with integration of outputs from DRAGEN secondary analysis in a user-friendly visual interface enables users to explore their multiomic data sets with confidence and ease
Built to provide integrated multiomic workflows from assays to insights, Illumina Connected Multiomics allows users to consolidate their multiomic analyses on a single, scalable platform to accelerate discoveries
| Instruments | MiSeq System, MiSeqDx Instrument, iSeq 100 System, NextSeq 550 System, NextSeq 2000 System, NextSeq 1000 System, MiSeqDx in Research Mode, MiniSeq System, NextSeq 550Dx in Research Mode, NovaSeq X System, NovaSeq 6000Dx in Research Mode, iScan System, NovaSeq 6000 System, NovaSeq X Plus System, MiSeq i100 System, MiSeq i100 Plus System |
|---|---|
| Software format | Cloud |
| Technology | Microarray, Sequencing |
Illumina Connected Multiomics enables high-resolution data analysis across a range of multiomic applications, including proteomics, transcriptomics, epigenomics, and genomics, and modalities, including single-cell and spatial analysis.
A highly customizable laboratory information management system that allows genomics labs to track samples and manage workflows efficiently and securely.
Easy-to-use cloud-based genomic run management and bioinformatics compute and storage environment for secure, high-performing sequencing operations.
Accurate, comprehensive, and efficient secondary analysis of next-generation sequencing (NGS) data.
A secure, scalable bioinformatics platform for seamless sequencer integration and flexible workflows.
BaseSpace Sequence Hub offers a wide variety of NGS data analysis apps for common Illumina sequencing methods.
Illumina Connected Multiomics
A powerful cloud-based multiomic analysis and interpretation software, enabling sample to insight workflows with interactive visualizations, infrastructure scalability, and secure data management.
An interactive omics knowledge base and data search engine that puts private data into biological context with highly curated public omics data.
Introduction to spatial transcriptomics technology
A high-resolution, sequencing-based spatial profiling technology for whole-transcriptome analysis within intact tissue architecture.
Genome and methylome sequencing
Achieve simultaneous high-accuracy genome and methylome discovery in a single readout with the Illumina 5-base genome solution.
Use multiomics profiling to multiply discovery power and better connect genotype to phenotype.
Leveraging proteomics to understand rare melanomas
Illumina Protein Prep is giving University of Colorado researchers a powerful, unbiased tool to interrogate these unique conditions
Illumina Connected Multiomics offers two tiers:
Includes preconfigured analysis workflows supporting select Illumina assays and is free to use. Requires sufficient iCredits to meet data storage and analysis needs based on throughput.
Includes preconfigured analysis workflows supporting select Illumina assays and the ability to create new custom workflows for Illumina and select third-party assays. Pathway analysis is enabled with the integration of Ilumina Correlation Engine or KEGG Pathway. Requires purchase of an annual or monthly license and sufficient iCredits to meet data storage and analysis needs based on throughput.
Visit the Order tab to learn more about the differences between these tiers.
For more information on iCredits, visit the iCredits Overview page.
| Feature | Basic | Professional |
|---|---|---|
| Deployed on Illumina regional instances of AWS cloud | ||
| Complimentary access to Illumina Connected Analytics Basic and Illumina BaseSpace Sequence Hub |
||
| Access to DRAGEN outputs | ||
| Advanced security and compliance | ||
| Default pipelines | ||
| Custom pipelines | ||
| Select third-party assay support | ||
| Pathway analysis and integrated Correlation Engine | ||
| Access | All domain and workgroup members | Seat-based license, 1 assigned user per license |

Proteomics
Sample distribution is visualized using a 2D scatterplot based on principal component analysis. Protein clustering patterns are displayed in a heatmap with dendrogram. Dot plot focuses on sample groups based on a specific protein expression. Pathway shows enrichment in one group compared to the other.

Single-cell analysis
Immune cell types are visualized by dimensionality reduction plots (UMAP and t-SNE), pie chart, and bar chart showing high expression of classical monocytes. The table depicts graph-based clustering biomarkers. The heatmap and bubble map show Z-score distributions and value prevalence for significant genes from a comparison. Gene set enrichment analyses figures highlight key biological KEGG pathways.

5-base sequencing
This plot was created using the 5-base methylation QC task by extracting and plotting statistics in the secondary analysis output metric files. From the QC report, we visualize sample-level QC metrics that describe read mapping quality and DNA methylation calling quality, for e.g., percentages of CpG methylation in the samples, in the unmethylated control, and in the methylated controls.

Spatial analysis
Detail of the habenular region of a pregnant mouse brain. The cells are colored by the results of the clustering performed on the data. A UMAP displays the clustering of the cells, and a pie chart shows the relative abundance of each cluster in the dataset.

Illumina Protein Prep assay data is showcased in Illumina Connected Multiomics to interactively explore proteomic data in biological context.

Introducing Illumina Connected Multiomics
Using a wide variety of interactive plots, meaningful patterns, biomarkers and pathways, Illumina Connected Multiomics brings biological data to life.

Explore the Illumina Connected Multiomics YouTube playlist for concise, high-value video insights into multiomic study design, assay workflows, data integration strategies, and actionable applications.
Illumina Connected Multiomics - Professional License - Trial
20141939
30-day trial for 1 user to access Illumina Connected Multiomics, including pre-configured workflows, custom workflows, and 100 iCredits for compute and storage.
List Price:
Discounts:
Illumina Connected Software – Basic License
20141940
Basic license to Illumina Connected Software including run planning, DRAGEN pipeline analysis, and pre-configured multiomic pipelines. Includes access to Illumina Connected Multiomics - Basic, Illumina Connected Analytics, and BaseSpace Sequence Hub.
List Price:
Discounts:
Illumina Connected Multiomics - Professional Annual License
20141942
1-year license for 1 user to access Illumina Connected Multiomics, including pre-configured and custom workflows with pathway analysis powered by Correlation Engine. Includes access to BaseSpace and Illumina Connected Analytics.
List Price:
Discounts:
Illumina Connected Multiomics - Professional Monthly License
20156707
1 month license for 1 user to access Illumina Connected Multiomics, including pre-configured and custom workflows with pathway analysis powered by Correlation Engine. Includes access to BaseSpace and Illumina Connected Analytics.
List Price:
Discounts:
Showing of
Product
Qty
Unit price
Product
Catalog ID
Quantity
Unit price
Illumina Connected Multiomics supports bulk proteomics, transcriptomics, epigenomics, and genomics, as well as single-cell and spatial transcriptomics.
For information on the data formats supported by Illumina Connected Multiomics, see the Illumina Connected Multiomics online help about Supported Data Types.
Visit out documentation for the most current information.
Visit the BaseSpace Online Help iCredit section for more in-depth information about BaseSpace iCredit usage.
Illumina Connected Software: Illumina iCredit Usage Explorer
No, Illumina Connected Multiomics is only available on Illumina AWS instances. For local cloud installation, contact us at info@illumina.com
Yes. As part of the Illumina Connected Software ecosystem, Illumina Connected Multiomics conforms to the Illumina security-first infrastructure, providing privacy and compliance to software requirements and regulations.
For a complete list of industry-standard statistical algorithms used in Illumina Connected Multiomics visit statistics used in Illumina Connected Multiomics.
Illumina Connected Multiomics provides comprehensive tertiary analysis including QA/QC, annotation, filtering, normalization, batch removal, statistics, exploratory analysis, region analysis, classification, biological interpretation, pathway analysis, and more. Visit Connected Multiomics task actions to learn more.
This automated NGS-based proteomics solution with SOMAmer technology and Illumina sequencing and analysis detects and quantifies 9.5K human proteins in 2.5 days.

Accessible and highly scalable single-cell RNA-Seq solution for mRNA capture, barcoding, and library prep without complex workflows or microfluidics

A single assay for comprehensive discovery of the 5-base genome (A, T, G, C, and 5mC), providing dual insights into the whole genome and methylome.

A single assay for targeted detection of five DNA bases (A, T, G, C, and 5mC), providing dual insights into genomic variants and methylation events.
Maximize genomic insights with Illumina DRAGEN secondary analysis, learn about the latest updates, read FAQs, and find product support.
Operationalize informatics and drive scientific insights with Illumina Connected Analytics. Contact us for information on pricing, subscriptions, and more.

An interactive omics knowledge base and data search engine that puts private data into biological context with highly curated public omics data.

Manage runs, analyze, store, and share sequencing data in BaseSpace Sequence Hub. Find applications, subscription options, and documentation.
Reach out for a demo or information about Illumina Connected Multiomics